
Vacuum Insulation Panels: Simulation Guide for Engineers


For thermal modeling purposes, treat vacuum insulation panels as time-dependent materials: center-of-panel lab values (~0.004 W/(m·K) pristine) are best-case numbers, not design inputs. Installed R-value calculations require edge-adjusted, aged conductivity inputs — typically 0.006–0.008 W/(m·K) after accounting for perimeter bridging and decades of gas permeation. The IEA-EBC Annex 39 report and Jewlztech’s Thermalysis Toolkit both support this framing: lab data is valid for the center zone only, and simulation workflows must carry three modeling levers from day one.
Center-panel conductivity: pristine k from guarded hot-plate tests, used as the lower bound
Edge conduction: thermal bridging from the metallized or foil barrier at panel perimeters
Time-dependent aging: k(t) or k(p) curves driven by gas and moisture permeation through the envelope
Pro Tip: At model setup, always run two parallel models: an edge-resolved 2D cross-section slice for the perimeter zone and a homogenized 1D center-panel baseline. Comparing the two immediately reveals how much of your installed R-value loss comes from the edge versus the core.
Table of Contents
How vacuum insulation panels achieve ultra-low thermal conductivity
What your simulation software must support to model VIPs accurately
Worked example: estimating installed R-value for a 20 mm VIP
Design and installation practices that change thermal performance
Projecting long-term VIP performance and setting maintenance triggers
Thermalysis Toolkit by Jewlztech: built for aging-aware VIP simulation
How vacuum insulation panels achieve ultra-low thermal conductivity
A VIP has three functional components, each with distinct modeling implications.
Core material: fumed silica, glass fiber, or aerogel variants. Fumed silica dominates high-performance applications because its nanoscale pore structure suppresses gas-phase conduction even at moderate vacuum levels. Key modeling properties: porosity, mean pore size, solid-phase conductivity, and opacifier content (for radiation suppression at elevated temperatures).
Gas-barrier envelope: multilayer metallized polymer film or aluminum foil laminate. The aluminum laminated film provides excellent barrier performance but introduces a highly conductive perimeter path. Metallized polymer films reduce edge conductance at the cost of slightly higher long-term permeation rates.
Getters and desiccants: active, finite-capacity components that adsorb residual gases and water vapor. Once saturated, internal pressure accelerates — high-fidelity lifecycle models should include getter saturation dynamics when field data are available.
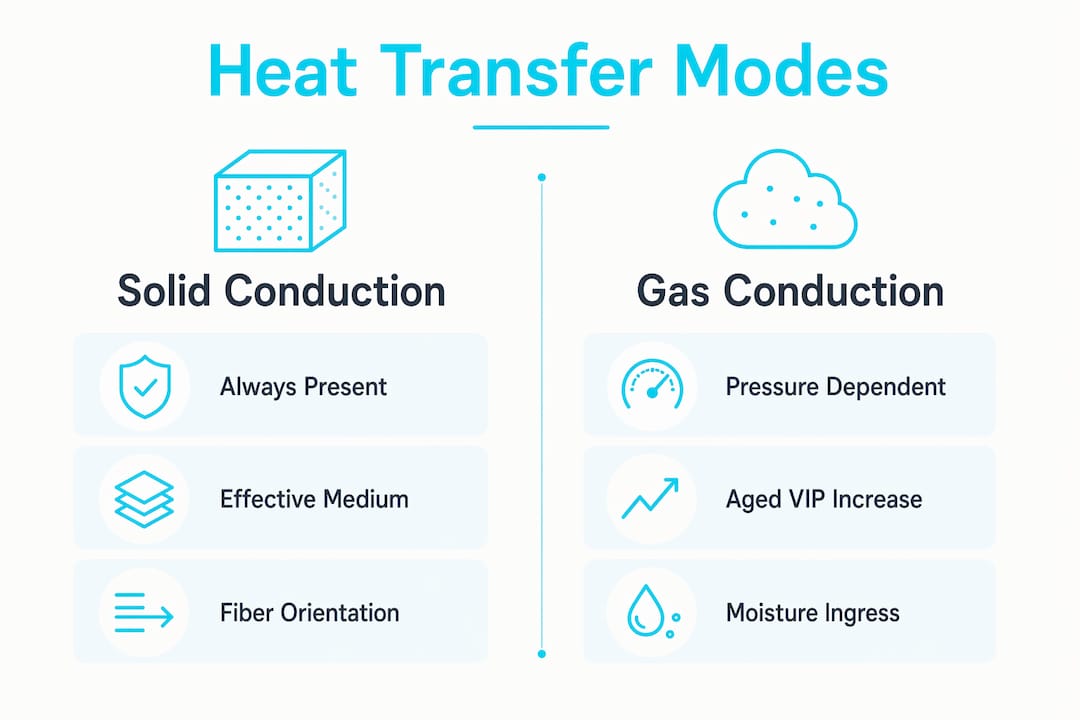
The dominant heat transfer modes shift with internal pressure. At pressures below ~1 mbar, gas-phase conduction is nearly eliminated and solid conduction plus radiation govern. As pressure rises due to permeation, gas conduction re-emerges. Engineers modeling VIPs at elevated temperatures must also account for radiation through the core — opacifiers (carbon black, silicon carbide) suppress this and belong in the material property definition.
Heat transfer mode | Dominant condition | Modeling approach |
Solid conduction | Always present | Effective medium k for core |
Gas conduction | Internal pressure > ~1 mbar | Pressure-dependent k(p) curve |
Radiation | High temperature or low opacifier | View factor or opacifier correction |
Edge conduction | Perimeter zone | 2D FEM slice with envelope geometry |
Pro Tip: Model the core as an anisotropic effective medium when the fiber orientation in glass-fiber cores is known — through-thickness k can differ from in-plane k by a measurable margin. See Jewlztech’s guide on anisotropic conductivity for the setup approach.
Pristine vs. aged performance and cost tradeoffs
A 20 mm fumed silica VIP leaves the factory at roughly 0.004 W/(m·K). That number will not hold for the asset life.
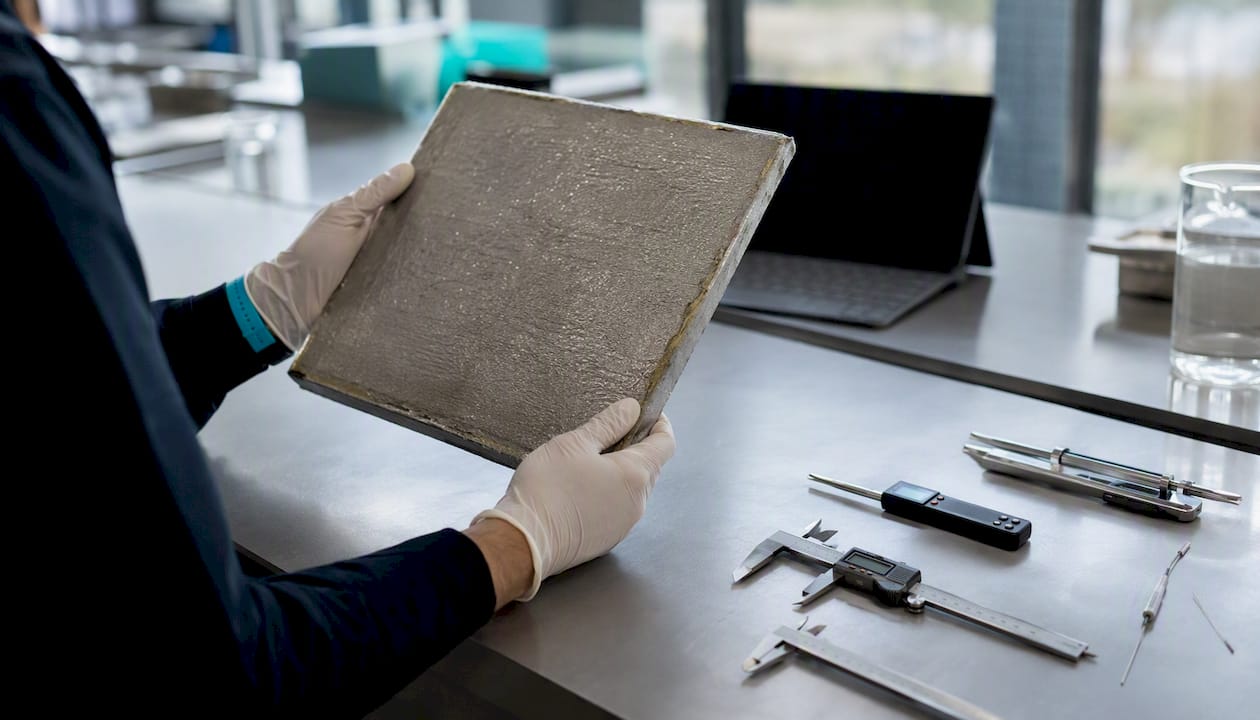
Gas diffusion and moisture ingress through the envelope gradually raise internal pressure, pushing conductivity upward. Field and review literature report installed values of 0.006–0.008 W/(m·K) after edge effects and decades of aging — a factor of 1.5–2× the pristine center value. Panels exposed to high humidity or elevated temperatures age faster; damage or puncture produces an immediate jump, potentially to ~0.02 W/(m·K) or higher depending on core type.
Condition | Typical k (W/(m·K)) | Service life |
Pristine center-of-panel | ~0.004 | Day 0 |
Installed, edge-adjusted | ~0.006–0.008 | After edge effects and aging |
Aged, ideal dry conditions | ~0.006–0.008 | 30–50 years |
Punctured or damaged | ~0.02+ | Immediate failure |
Cost and thickness tradeoffs worth keeping in the model:
Thinner panels (10 mm) have a higher surface-area-to-volume ratio and age faster than 20 mm panels under equal conditions.
Larger, more square panels reduce the perimeter-to-area ratio, slowing edge-driven aging per unit area.
Fumed silica cores cost more than glass fiber but deliver lower pristine k and better long-term stability.
VIPs justify their cost premium in space-constrained assemblies; when thickness is not a constraint, conventional insulation is often more cost-effective.
Pro Tip: Run your aging sensitivity study at three k scenarios — pristine, mid-life (+0.002 W/(m·K)), and end-of-life (+0.004 W/(m·K)) — before committing to a panel thickness. The end-of-life scenario often drives the design.
The edge effect and how to quantify it in simulations
The edge effect is the dominant source of installed performance loss in most VIP assemblies. The metallized or aluminum barrier layer wraps around the panel perimeter, creating a conductive bypass that never appears in center-of-panel guarded hot-plate data. Lab measurements are valid for the center zone only; installed system U-values are consistently higher.
The magnitude of the penalty depends on panel size, facer conductivity, and contact conditions at the seam. Keeping panels larger than half a meter square and as square as practical reduces the perimeter-to-area ratio and limits the fractional contribution of edge losses.
Steps for a 2D edge-resolved FEM slice:
Build a cross-section geometry that includes the full panel thickness, the envelope layers (typically 0.1–0.2 mm total), and the adjacent assembly materials.
Assign the envelope a conductivity matching the actual barrier film — aluminum foil (~200 W/(m·K)) vs. metallized polymer (~0.2–1 W/(m·K)).
Set boundary conditions: fixed temperature on outer faces, convective or adiabatic on cut edges depending on assembly symmetry.
Mesh the envelope with at least 3–5 elements through its thickness; use a graded mesh transitioning to coarser elements in the core.
Post-process: extract total heat flux across the assembly width, compute effective U, and back-calculate installed R for the full panel including edge zone.
Approach | When to use | Accuracy |
Homogenized edge correction factor | Preliminary sizing, parametric sweeps | Moderate |
2D FEM edge slice | Design validation, material selection | High |
3D FEM full panel | Corner effects, complex geometries | Highest |
Pro Tip: Use the homogenized correction factor for early-stage parametric runs, then validate one representative geometry with a full 2D slice before finalizing panel selection.
Modeling pitfalls that produce systematic error
Steady-state center-of-panel models underpredict installed heat transfer — sometimes significantly. Here are the failure modes to watch.
Thin-layer representation: envelope layers under 0.5 mm require explicit meshing or a contact conductance boundary; smearing them into the bulk produces wrong edge flux.
Contact resistance at interfaces: gaps between a VIP and adjacent layers (adhesive, mortar, air gap) add thermal resistance that partially offsets edge bridging — model both, not just one.
Imperfect seals and seam overlaps: factory seams at panel edges create localized conductance spikes; treat them as a higher-conductivity strip in the edge model.
Localized punctures or folds: a single pinhole raises local k to near-ambient-air values; flag these as a separate failure scenario in sensitivity runs.
Transient behavior: pressure and temperature cycling changes internal gas pressure over time; steady-state models miss this unless k(t) or k(p) curves are applied.
Never assume a VIP can be cut, drilled, or penetrated on site. Any breach of the envelope destroys the vacuum instantly. In a simulation context, model a punctured panel as a conventional porous material at ambient-pressure k — the performance loss is immediate and total. Pre-fabricated penetrations with sealed edges are the only permissible option, and they must be modeled explicitly.
Validation checklist:
Compare center-zone model output against guarded hot-plate lab data for the same core material.
Run mesh convergence on the edge slice — halve element size and confirm heat flux changes less than 2%.
Perform a sensitivity study: vary edge conductivity ±50% and record installed R change.
Check against any available field measurement or bench test dataset for the assembly type.
A practical simulation workflow from spec to validation
Define use case and boundary conditions: operating temperature range, humidity exposure, assembly geometry, and required service life.
Set initial core k: use pristine center-of-panel value (~0.004 W/(m·K) for fumed silica) as the lower bound.
Select envelope properties: assign barrier film conductivity and thickness; choose aluminum foil or metallized polymer based on vendor data.
Build the edge-resolved 2D slice: follow the meshing and boundary condition steps from the edge effect section above.
Run the homogenized 1D center-panel model: confirm it matches lab data within acceptable tolerance.
Run sensitivity study: vary internal pressure (or k directly), edge conductivity, getter capacity, and panel size; record installed R at each scenario.
Apply aging projection: step k(t) through pristine, mid-life, and end-of-life scenarios; va-Q-tec long-term tests on 20 mm silica panels show gas pressure increases on the order of ~1 mbar/year under favorable conditions, which can parameterize the pressure ramp.
Calibrate to bench data: adjust contact resistance and edge conductivity until model output matches measured assembly U within your project tolerance.
Sample model inputs for a 20 mm fumed silica VIP:
Pristine center k: 0.004 W/(m·K)
Edge-adjusted k after aging: 0.006–0.008 W/(m·K)
Envelope conductivity (aluminum foil): ~200 W/(m·K); (metallized polymer): ~0.2–1 W/(m·K)
Contact resistance at adhesive interface: 0.001–0.005 m²·K/W (verify against assembly)
Panel size target: at least medium-large panel dimensions to limit edge-area ratio
Pro Tip: For CFD boundary conditions in coupled convection-conduction problems, apply the effective installed U (not the center-panel U) at the VIP assembly face — using the lab number here is one of the most common sources of over-optimistic building energy model outputs.
When to use transient vs. steady-state: steady-state is sufficient for annual energy calculations if you apply the correct aged k. Use transient (time-dependent k(p)) when projecting service life, sizing getters, or modeling a specific failure timeline.
What your simulation software must support to model VIPs accurately
Not every thermal solver handles VIPs well out of the box. Before committing to a tool, verify these capabilities:
Variable material properties over time and temperature: k(t) and k(p) curve input, not just a single scalar
Thin-layer modeling: explicit meshing or contact conductance boundary for sub-millimeter envelope layers
Contact conductance at interfaces: user-defined values, not just perfect contact
Fine mesh control at edges: local refinement without global mesh explosion
Parametric and sensitivity automation: batch runs across k, pressure, and geometry variables
Radiation support: view factor calculation or opacifier-based correction for high-temperature applications
Custom material database: ability to store and retrieve time-dependent property curves for repeated use
Feature | Why it matters | Verification test |
Variable k(t) | Aging projection accuracy | Run pristine vs. aged scenario; confirm different outputs |
Thin-layer meshing | Edge flux accuracy | Mesh convergence study on envelope layer |
Contact conductance | Interface resistance modeling | Sensitivity run: vary contact R, check installed U |
Parametric automation | Sensitivity study efficiency | Batch run across 5+ k values without manual re-entry |
Radiation view factors | High-T or low-opacifier cores | Compare with/without radiation term at 80°C |
Pro Tip: Store your k(t) curves as named material profiles in the software database — one for pristine, one for mid-life, one for end-of-life. Swapping profiles across scenarios takes seconds and eliminates manual re-entry errors.
Worked example: estimating installed R-value for a 20 mm VIP
A 20 mm fumed silica VIP with center k = 0.004 W/(m·K) and an aluminum foil barrier yields an installed R of roughly 3.95 m²·K/W in pristine condition; after aging under dry conditions, expect installed R to drop to around 2.48 m²·K/W as conductivity rises to typical aged ranges.
Calculation steps:
Center-panel R (pristine): R_center = thickness / k = 0.020 m / 0.004 W/(m·K) = 5.0 m²·K/W
Edge conductance estimate: for a 0.6 m × 0.6 m panel with aluminum foil barrier, edge linear thermal transmittance (Ψ) is typically in the range of 0.005–0.010 W/(m·K) per unit perimeter length (vendor and literature guidance).
Effective installed U: U_installed = U_center + (Ψ × perimeter) / area = 0.200 + (0.008 × 2.4) / 0.36 ≈ 0.200 + 0.053 = 0.253 W/(m²·K)
Installed R (pristine, with edge): R_installed = 1 / 0.253 ≈ 3.95 m²·K/W
Aged scenario (25 years): repeat with k = 0.008 W/(m·K); R_center = 2.5 m²·K/W; U_installed ≈ 0.400 + 0.053 = 0.453 W/(m²·K); R_installed ≈ 2.21 m²·K/W
Scenario | Center k (W/(m·K)) | Edge Ψ (W/(m·K)) | Installed R (m²·K/W) |
Pristine | 0.004 | 0.008 | ~3.95 |
End-of-life (25 yr) | 0.008 | 0.008 | ~2.21 |
Validate this result by comparing center-zone U against guarded hot-plate lab data for the same core. If field measurements are available, adjust the contact resistance term until model and measured assembly U agree within your project tolerance.
Design and installation practices that change thermal performance
Simulation accuracy means nothing if installation introduces unmodeled losses. These site decisions directly affect what your model must represent.
Never cut VIPs on site: any envelope breach destroys the vacuum immediately and permanently. Pre-fabricated panels with sealed penetrations are the only option for penetration-critical assemblies.
Avoid compressive loading beyond core limits: over-compression crushes the porous core, raises solid-phase conductivity, and changes the contact geometry your model assumed.
Protect edges during handling: edge damage to the barrier film is the most common installation failure mode; model edge-damaged panels as a higher-conductivity strip.
Use compressible joint materials at seams: gaps between adjacent VIPs create air-filled thermal bridges; fill with low-conductivity compressible foam and include the joint conductance in the model.
Store panels in low-humidity, controlled conditions: moisture exposure before installation accelerates desiccant saturation and shortens effective service life.
Document handling logs: any panel that has been dropped, bent, or stored improperly should be flagged for bench testing before installation.
Pro Tip: Include a tolerance analysis in your simulation: model the as-designed gap between panels at 0 mm, 2 mm, and 5 mm. The 5 mm air-gap scenario often reveals a larger installed U penalty than the edge bridging itself.
Projecting long-term VIP performance and setting maintenance triggers
Aging is not a uniform process. The trajectory depends on initial conditions, environment, and whether any damage events occur.
Scenario planning for lifecycle models:
Ideal dry conditions: service life of 30–50 years is realistic; model k as a slow ramp from 0.004 toward 0.007–0.008 W/(m·K).
Humid or high-temperature exposure: desiccant saturation accelerates; shorten the service life projection and apply a steeper k(t) ramp.
Puncture or damage event: model as immediate step-change to ~0.02 W/(m·K) or ambient-pressure core k; no recovery.
Modeling aging as a ramp:
Parameterize internal pressure as a linear ramp (~1 mbar/year for a well-protected 20 mm silica panel under favorable conditions).
Convert pressure to k using the core’s k(p) relationship from manufacturer data or literature.
Apply getter saturation: once getter capacity is exhausted, pressure rise accelerates — include a saturation threshold in the lifecycle model if getter data are available.
Discretize service life into 5-year intervals for projection; run steady-state at each interval and record installed R.
Risk mitigation inputs for the model:
Add a protective layer (rigid board or membrane) to the assembly and model its contribution to reducing mechanical damage probability.
Place humidity or pressure sensors in accessible assemblies; set a replacement trigger when measured field R drops more than 20% below the design value.
Schedule bench testing of representative panels at 10-year intervals for long-life applications.
Key Takeaways
Installed VIP performance is always lower than center-of-panel lab data suggests: edge conduction, aging, and installation quality each reduce effective R-value, and all three must appear in any credible simulation.
Point | Details |
Use aged inputs, not lab k | Pristine center k (~0.004 W/(m·K)) is a lower bound; design with 0.006–0.008 W/(m·K) for edge-adjusted, aged installed performance. |
Model the edge explicitly | Edge conduction from the barrier film is the dominant installed loss; a 2D FEM slice is required for accurate U-value calculation. |
VIPs cannot be modified on site | Cutting or penetrating a panel destroys the vacuum; plan dimensions and penetrations before fabrication. |
VIPs suit space-constrained assemblies | Where thickness is not a constraint, conventional insulation is often more cost-effective than VIPs. |
Thermalysis Toolkit supports aging-aware workflows | Jewlztech’s Thermalysis Toolkit handles variable k(t), thin-layer modeling, and parametric sensitivity runs for VIP simulation. |
The gap between lab numbers and field reality
The single most common modeling mistake with VIPs is treating the guarded hot-plate center-of-panel number as the installed system value. Engineers who do this build assemblies that underperform their design targets by a meaningful margin, sometimes enough to miss energy code compliance. The physics are not subtle: a conductive metal film wraps every panel edge, and that film does not appear in any center-zone test.
The calibration trick that actually works: run your 2D edge slice, extract installed U, then compare it against any available field measurement for a similar assembly. If they agree within 10–15%, your contact resistance and edge conductivity assumptions are reasonable. If they diverge more than that, the contact resistance term is almost always the culprit, not the core k. Jewlztech’s Thermalysis Toolkit is built for exactly this kind of iterative calibration: variable material properties, parametric runs, and a property database that stores k(t) curves for repeated use across projects.
Thermalysis Toolkit by Jewlztech: built for aging-aware VIP simulation
Engineers who need to move from a pristine center-k assumption to a full aging-aware installed R-value calculation need a tool that handles variable material properties, thin-layer geometry, and parametric sensitivity in one workflow. The Thermalysis Toolkit by Jewlztech is designed for exactly that.

Key capabilities that map directly to the VIP modeling checklist:
Variable k(t) and k(p) input: store pristine, mid-life, and end-of-life material profiles and swap them across parametric runs without manual re-entry
Thin-layer and contact conductance modeling: explicit interface resistance inputs for envelope layers and seam joints
Edge-resolved 2D slice support: conduction analysis with fine mesh control at perimeter zones
Parametric sensitivity automation: batch runs across k, pressure, and geometry variables in a single session
Built-in property database: store and retrieve time-dependent curves for repeated use across VIP projects
The toolkit is available as a downloadable Excel-based tool with a monthly subscription. Start your first aging-aware VIP simulation today at the Thermalysis Toolkit product page.
Key references and further reading
Primary sources cited in this article:
IEA-EBC Annex 39 Project Summary Report — Vacuum Insulation Panel Properties & Building Applications: the authoritative reference for VIP component behavior, service life, edge effects, and aging under building conditions.
va-Q-tec — VIP technology and application notes: vendor technical guidance on barrier film selection, edge bridging, and long-term pressure evolution in silica VIPs.
ScienceDirect — Vacuum insulation panel topic overview: peer-reviewed literature summary covering aging mechanisms, puncture effects, and conductivity ranges.
Panasonic — Vacuum insulation panel technical page: manufacturer data for pristine center-of-panel k values and product specifications.
Wikipedia — Vacuum insulated panel: useful summary of installed k ranges from field and review literature.
IIBEC — What is a Vacuum Insulation Panel? (Mukhopadhyaya et al.): National Research Council of Canada field application data and best-practice guidance for building envelope VIP systems.
Jewlztech Thermalysis Toolkit: product page for the aging-aware thermal simulation toolkit referenced throughout this article.
For model calibration, consult guarded hot-plate lab datasets from the panel manufacturer alongside any available field measurement reports for the specific assembly type. The IEA-EBC Annex 39 report contains both center-zone and installed measurement comparisons that serve as a reliable benchmark starting point.
Recommended
Comments